 Task Relay
Task Relay guides · Research / Model / Present
Turn site research into a pre-schematic deck
Stop rebuilding the location, climate and vegetation research pack for every project. Collect the evidence once, review it, then make an editable presentation.
The problem
How to create site-analysis maps and graphics that clearly present your project location? Start with the evidence, select the useful visuals and assemble them into a research deck.
What you can make
A source register, a reviewed outline and a new PPTX covering location, historical climate, regional vegetation and early design questions. Text, tables and charts stay editable; photographs and map captures remain images.
You provide: the location, project brief, boundary if known, intended audience and any selected images. Browser research needs a configured research route. PPTX creation needs the presentation operation to report available.
Give Relay this request
Prepare a pre-schematic research pack for [location] and [project type].
Use my attached brief and boundary. Research location, climate and regional
vegetation through the available browser research tools. Return a source
register with URLs, dates, units, image credits and gaps, plus a slide outline.
Separate observed site facts from regional references and design assumptions.
For a location image, check whether browser screenshot capture is available.
If available, propose one PNG capture from [exact map URL], with its source
record, for my visual review. Otherwise ask me to supply the image.
Stop for my selection of the evidence and image files. Then propose a new
editable PPTX using those files, native text, tables and climate charts.
Keep citations and assumptions in the deck. I will open it to review layout.
Work through three small stages
- Research: ask for source URLs and dates, climate station and measurement period, units, plant references and missing inputs. Check the sources before choosing evidence.
- Select visuals: supply PNG/JPEG files or review a permitted browser capture. Keep credits and source records. A map screenshot locates the study area; it does not supply editable GIS geometry, a surveyed boundary or verified scale.
- Assemble: select the evidence and images, approve the presentation plan and open the returned PPTX to check captions, chart labels and layout.
Browser screenshot capture is bundled in the audited 0.13.24 app. It requires a supported browser worker and a plan granting the exact site and output file. The worker receives image metadata, so you must check that the location and map tiles actually appear. Google Maps capture has not been qualified in this guide. A user-supplied location image works for the same deck stage.
A worked Barcelona example
The seven-slide example covers Parc de la Ciutadella, a climate-station locator diagram, historical climate charts and regional plant references. The locator is a diagram, not an imported map. The deck was authored and visually checked with local authoring tools; it is an example of the intended output, not proof of Relay completing the whole workflow.
Download the example PPTX · Source and image register
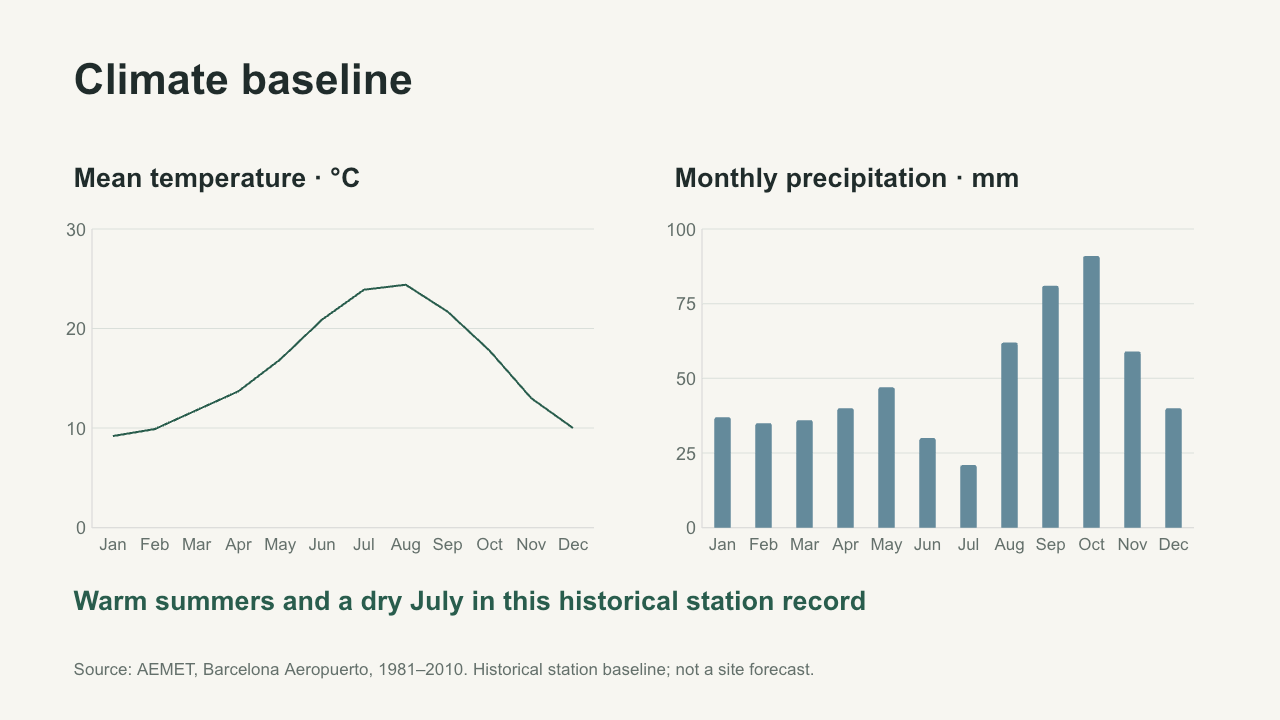
The sample uses AEMET airport normals for 1981–2010, a historical regional baseline. Its Collserola plant references do not establish which species occur on the site. Research diagrams do not replace sun/shadow calculations, wind analysis or a site survey.
For the final assembly stage, use the design presentation guide.
Capability check: Browser research, scoped screenshot capture and pptx.create are present in the audited app bundle. See the operation documentation for implementation scope and recorded checks. This article is a workflow recipe; its exact prompt has not been qualified through a complete live Relay run. Forum reports establish a problem, not measured time savings.